Archive for January, 2010

Is Facebook Still Cool?

Posted January 30, 2010 By s.applegate

While some media agencies believe that Facebook usage among younger consumers is starting to slip, others are arguing that this perception is due to the way usage is being reported. Younger consumers are accessing the site via mobile phones, but currently there is no single source that aggregates consumption statistics from all platforms so the younger age cells are likely under-reported.

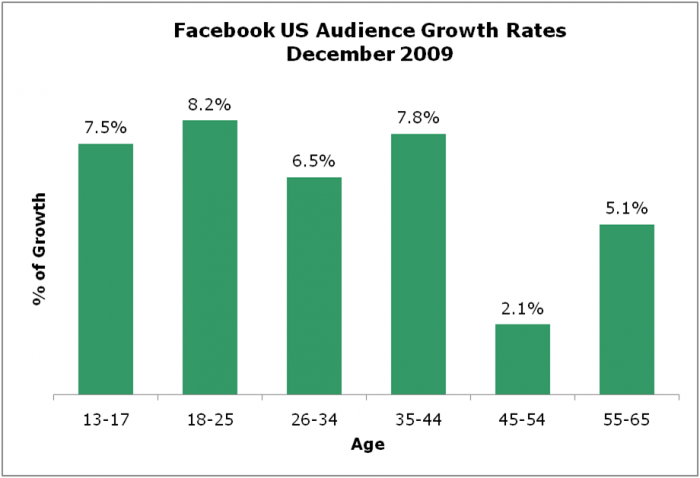
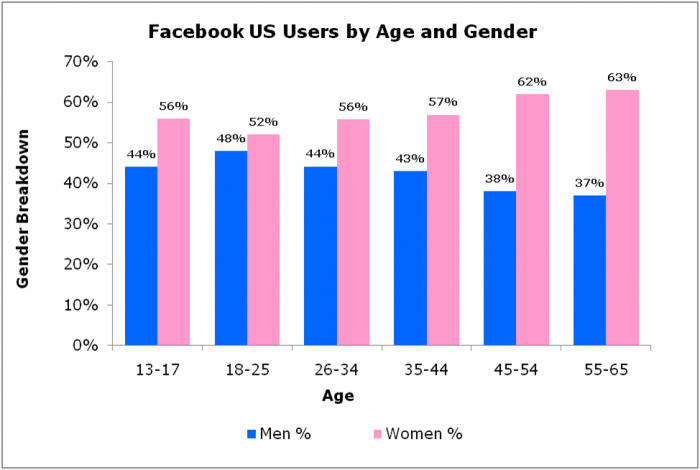
According to Facebook, their overall growth is steady. Almost 5 million users have signed up in December, while the previous two months recorded increases of approximately 4 million each, with the coveted 18-25 age cell reportedly growing 8.2 percent. Here’s how the December growth rates are distributed across the various Facebook reported age breaks:

While women continue to lead in usage across all age groups, it remains the most popular social networking site, globally and in the US. According to Nielsen, the average time spent on Facebook by US users has grown by 200 percent from December ’08 to December ’09. The data suggests that it most certainly still has the “cool” factor among users and marketers alike.

Share
2 Comments so far. Join the Conversation

Crowdsourcing For Dummies

Posted January 30, 2010 By s.applegate

Businesses and institutions are beginning to recognize the power of social media tools and sites to engage in crowdsourcing, also known as “social answers” or “help engines”.By definition, it means to tap into the collective intelligence of the public in order to complete a task, find a solution to a problem, etc. by asking a wide range of people or organizations if they can help, typically by using the Internet. Allowing businesses to enlarge their talent pool without increasing labor costs, it also improves creativity and capitalizes on competition as well as team work. The customer feedback is therefore enriched and quite possibly, in the most sincere form.

Execution is relatively simple:

  1. Company uses a social networking site to invite people to participate in a project. This could be anything from creating an ad, developing software or applications to solving a complex R&D problem
  2. Enthusiasts respond with ideas and form a community in which they collaborate on the project and learn from one another
  3. The winner gets a monetary prize, recognition or royalty rights.

The technique has been implemented successfully by a number of companies, a few of which are shared below:

Netflix who used it to improve its algorithm to predict customers’ movie ratings

L’Oreal successfully used crowdsourcing to produce a TV spot for $1K that normally would cost upwards of $160K

iStockphoto was judgmentally an early adopter of the technique back some 4-5 years ago, when they invited amateur photographers to upload their photos and videos and earn royalties each time their images were licensed

Threadless who lets their online members submit T-shirt designs and vote on which ones should be produced

Dell deployed Ideastorm.com as a crowdsourcing engagement tool to solicit ideas on new products, resulting in 9,400+ ideas posted on their site that were collectively voted on more than 644,000 times.

Key factors for success:

Expectation management: Be prepared to deal with ideas that can get you distracted from the real goal of the project.

Project infrastructure: To minimize vague answers, be specific in your questions and clear with your goals and deadline.

Corporate culture shift: Participants are not your company employees, so their work, actions and comments can’t be controlled.

Participation encouragement: To attract and entice the crowd, rewards and incentives must be offered.

Technological readiness: Participation usually comes in one big wave so make sure your platform can handle the traffic.

Measurable progress: If possible, create a means by which participants can gauge the success of their ideas.

If used properly, crowdsourcing can provide you with thousands of great ideas and probably several different ways to complete the task at hand. Used improperly, it can derail you and put your company in a negative publicity mess. As with everything else, research, plan and implement wisely.
Share
4 Comments so far. Join the Conversation

Super Bowl ROI

Posted January 30, 2010 By s.applegate

It is mind-boggling that a 30-second spot during the Super Bowl can cost as much as $3 million dollars and CBS just announced that they have sold out all the spots for 2010. Most advertisers don’t commit without tremendous analysis and evaluation, though they typically reach their decision on an annual basis. Repeat advertisers assess the performance of their commercials during and after the previous year’s game and many even prior to the actual airing by leveraging the power of the Internet.

The Super Bowl is viewed by an average of 98.7 million people – roughly a third of the country. With such a huge audience, Super Bowl commercials often result in immediate sales increases. Here are some specific company examples:

—In the past five years, CareerBuilder’s sales have increased by 40 percent each year in the three months following the Super Bowl

The market share for GoDaddy.com jumped from 16 percent to 25 percent after their first ad ran in 2005 and it has risen steadily since then by 32 percent

—On Super Bowl Sunday, 2005 website traffic increased 594 percent for Budweiser.com which was the biggest increase registered by any advertiser that year

—In 2009, Teleflora’s saw an increase of 1,464 percent in the number of online mentions the brand received in the days immediately following its Super Bowl ad. The goal was to get people to order flowers for Valentine’s Day.

Consumer package goods companies typically see an 11+ percent sales increase in the month following the game. Additionally, brand awareness scores rise, website traffic and search volume increases and the commercials are posted on YouTube providing repeat exposure in a new, viral way. In terms of efficacy, one Super Bowl commercial can be compared to 250 regular TV commercials. So, $3 million dollars for a Super Bowl ad, anyone?

Source: Advertising Age 1/25/2010, Bloomberg 1/21/2009, ZDNet Research 2/9/2005

Share
Be the first to comment

Consumer Trust – Where Art Thou?

Posted January 30, 2010 By s.applegate
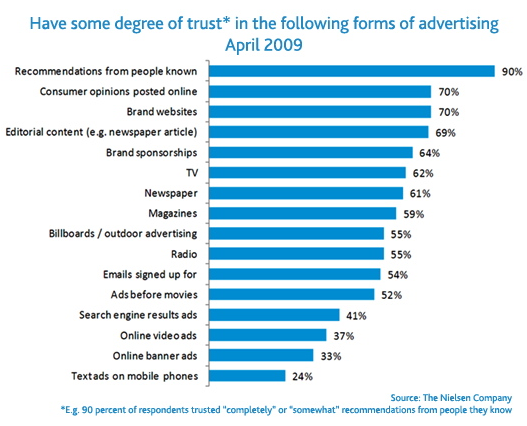
Chart I Consumer Trust

Forms of Advertising - Degree of Trust

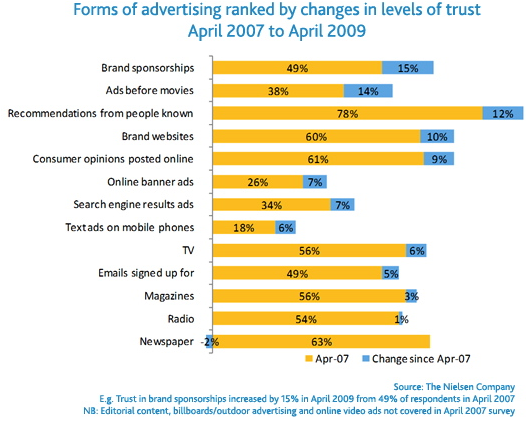
Chart 2 Consumer Trust

Forms of Advertising - Change in Degree of Trust

It’s no surprise that based on the Nielsen Global Online Consumer Survey, 90 percent of people trust recommendations from others they know. The survey also shows that 70 percent trust consumer opinions posted on brands’ websites and online in general.

—The greatest increase in consumer trust measured over a 2-year period is in the brand sponsorship category. A very close second is seen in the cinema advertising category.

—Although newspaper advertising is the only media form that recorded a drop in consumer trust, it still remains a widely trusted source with 61 percent surveyed reporting trust of the medium.

Perhaps the most interesting findings show that the newest and hottest media forms still have a lot of work ahead of them to earn consumer trust. Only 24 percent trust text ads on mobile phones, 33 percent trust online banner ads, 37 percent trust online video ads and 41 percent trust search engine results.

While experts point out that the biggest issue is the way in which online ads are served, there are also learnings that the online media community can capitalize on as it relates to the increase in trust of brand sponsorships. Finding ways to offer more sponsorship opportunities would allow them to leverage the trustworthiness of brand websites and by association, improve their own credibility scores.

Share
Be the first to comment

Latest Media Value Plays

Posted January 20, 2010 By s.applegate


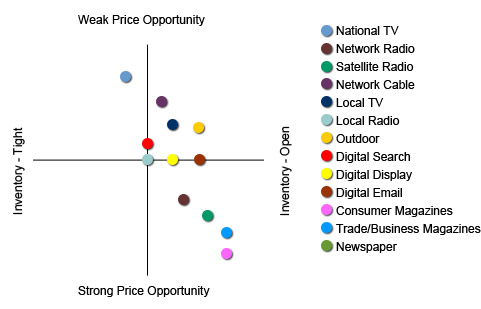
CURRENT MEDIA OPPORTUNITY TRENDS

CURRENT MEDIA OPPORTUNITY TRENDS

Advertising, and media specifically, has been hit by the recession bug, but it appears to be turning the corner. Before it shifts into overdrive, we’ve compiled a quick snapshot of what Applegate Media Group is seeing in terms of latest trends and areas of opportunity.

National TV: Price opportunities somewhat limited – requires creativity. In general, they’re selling 1st quarter scatter ad inventory at rates between 20-25% above upfront pricing.

Network Radio: Reasonable opportunity pricing exists with ample available inventory.

Satellite Radio: Favorable pricing has been secured lately and inventory is relatively plentiful.

Network Cable: As is the case with National TV, cable networks are also experiencing a strong 1st quarter scatter market which is expected to continue into Q2. Broadcast changes to the 10PM time slot appear to have driven viewers to cable – also contributing to their strong quarter and fewer pricing opportunities.

Local TV: Quite varied on a market by market basis. Top markets of New York and Los Angeles appear to be gaining momentum but are still down overall. Categories that appear to be driving the activity are Automotive, Fast Food, Consumer Electronics and Telecom.

Local Radio: Typically, 1st quarter presents terrific rate opportunities for spot radio and this year is no different. While it varies by market, there are some value plays out there now.

Outdoor: Inventory is relatively open as evidenced by shorter lead times required to secure premium placements.

Digital Search, Display & Email: There are opportunities in early 2010 but there are also reports of increased demand in some categories and projections that advertisers are looking to invest further ahead than most did in ’09. Recent J.P. Morgan predictions are that digital display ad spending will surge in 2010 and CPMs will rise by approximately 5%.

Consumer & Trade Magazines: Recession hit this group hard. Inventory remains open with ample avails at competitive pricing.

Newspaper: While inventory remains open, not as competitive with pricing as we believe they should be. That tune has been playing out for decades however!

Share
6 Comments so far. Join the Conversation

January Cocktail Party Chatter

Posted January 13, 2010 By s.applegate

If you’re ever at a loss to fill those awkward moments or eliminate the pregnant pauses, we have some ideas that are sure to be a hit, make you look so smart and above all – avoid the taboo subjects.

—The best website of 2009 was Flickr according to Time Magazine for its pioneering technology called collaborative tagging of visual images.

—The most buzzed about ad campaign of 2009 was Snickers “Snacklish” earning a 71.67 Zeta Buzz Ranking.

—The top city for employment in 2010 is Mt. Vernon, WA for its best of both worlds location. It’s only 60 miles from Seattle — so close enough for weekend getaways and quaint like a rural town without the downfall of being in the middle of nowhere.

—The record for the most cocktails made in one hour is held by Christopher Raph of Minneapolis who made 662 different drinks — each using at least three ingredients — in April of 2009. That’s an average of 11 cocktails a minute!

Share
4 Comments so far. Join the Conversation

AMG January Quick Tip

Posted January 13, 2010 By s.applegate

HOW TO SUCCESSFULLY MANAGE YOUR INBOX

If you’re like many busy folks, the speed with which your email inbox fills each day can sometimes be overwhelming. Do you catch yourself playing mind games against Outlook to see how long you can keep pace with less than 3 unread emails only to find that by 9:45, you’re defeated? Or, realize that much of what you’re receiving is not critically important but requires you to sift through it all like a bad game of minesweeper? Sound familiar?

Organization is the key to success in a fast-paced business environment and email rules play a vital role. You can start small and build your organizational kingdom over time.

1) Start by designating a flag color code or creating a special folder for emails from your boss and all upper management (based on Outlook)

2) Next, create a rule for your subordinates defining a different flag color or creating a new folder for the group

3) Then, proceed through your list of common inbox occupants

—tip: flag colors can get a little busy and remain in your inbox while folders are neatly moved / organized as subfolders under your inbox
—tip: a good rule of thumb is if you receive ten or more emails per day from an individual, assign an individual flag color/new folder

    Now, the keys to the kingdom of organization are all yours!! I recommend starting small with just your boss and upper management designated with a special flag color or new folder so that you have an opportunity to see how the overall functionality works before you build-out your entire electronic filing cabinet.

    Share
    Be the first to comment

    The Decade in Review

    Posted January 13, 2010 By s.applegate
    THE DECADE IN REVIEW
    Metric 2000 2009 % Change
    Text Messages monthly 450 million 83+ billion 18419%
    Google Searches monthly 112.5 million 6.75 billion 5900%
    Home Broadband use 3% 63% 2000%
    DVR households 3.5 million 31 million 786%
    Time Spent online 30 minutes 4 hours 700%
    Social-network use 8.00% 46.00% 475%
    Online ad spending 7.2 billion 23 billion 219%
    TV channels 61 130 113%
    Online purchasers 28% 55% 96%
    Own Cell phone 50% 85% 70%
    Cost of 30-second Super Bowl spot 2 million 3 million 50%
    Internet use 53% 75% 42%
    National cinema box-office take 6.7 billion 9.4 billion 40%
    Total ad spending 102.7 billion 141.7 billion 38%
    Credit card users 159 million 181 million 14%
    Hours of TV watched 52 58 12%
    Dial-up use 40% 10% -75%
    “2000” is defined as year 2000 data point or the earliest date tracking became available. “2009” is defined by most recent data available as of 1.6.10
    Multiple research sources utilized in the preparation of The Decade in Review. Contact AMG for complete source listing.
    Share
    Be the first to comment
    css.php